





Building a successful business requires optimism, but protecting one requires something equally important: the ability to measure risk before it becomes a problem.
Entrepreneurs regularly make decisions involving uncertain outcomes. They invest in marketing, hire employees, enter new markets, negotiate with suppliers, borrow money, manage currencies, and sometimes allocate personal or company capital to investments. None of these activities is completely predictable.
That is where financial risk management tools become useful. They turn vague concerns such as “What if this goes wrong?” into measurable questions: How much can we afford to lose? What happens if revenue drops by 20%? How exposed are we to one client, one currency, or one investment?
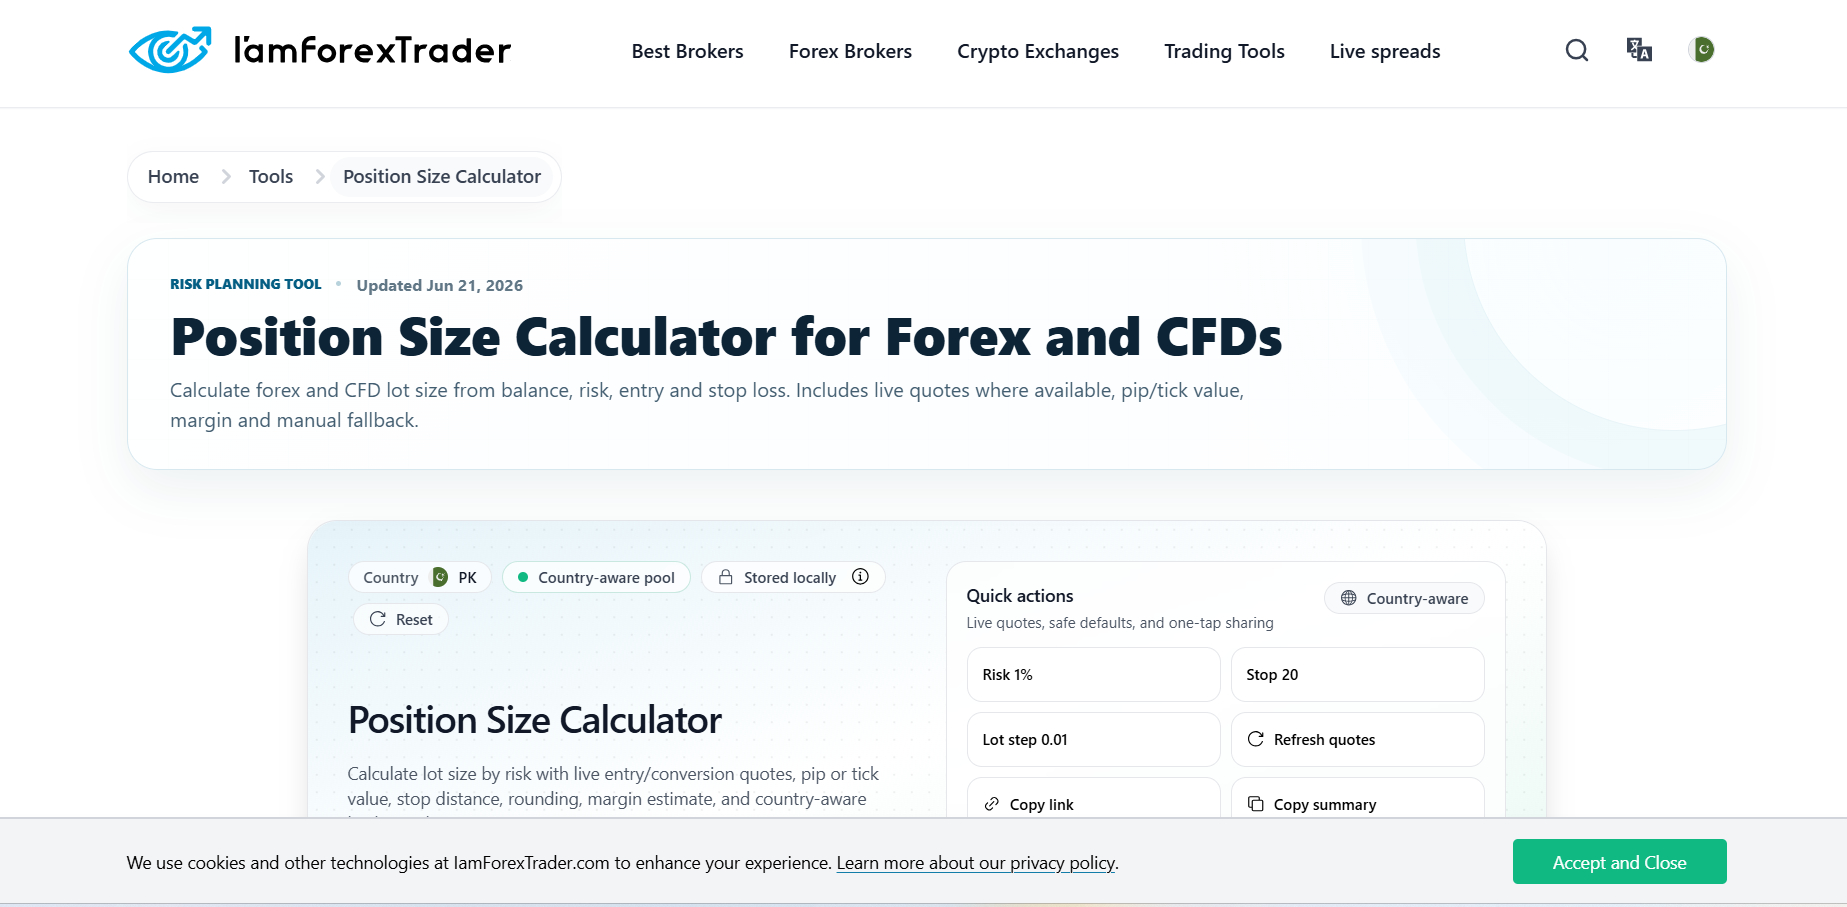
The same principle applies to active investing. For example, anyone trading currencies can use a forex position size calculator to determine how large a position should be based on account size, stop-loss distance, and the amount of capital they are prepared to risk. Instead of guessing, the trader converts risk tolerance into a number.
That mindset is useful far beyond trading.
What Is Financial Risk Management?
Financial risk management is the process of identifying financial threats, estimating their possible impact, and deciding how much exposure is acceptable.
The goal is not to remove every risk.
If businesses avoided every uncertain decision, few would ever launch a new product, hire their first employee, expand internationally, or invest in growth.
The objective is to make risks visible, measurable, and manageable.
“Good risk management does not eliminate uncertainty. It makes uncertainty easier to survive.”
For an entrepreneur, financial risks can come from many directions:
- falling revenue;
- rising operating costs;
- customer concentration;
- currency movements;
- debt obligations;
- interest-rate changes;
- failed investments;
- fraud;
- liquidity shortages;
- unexpected taxes or regulatory costs;
- late-paying customers;
- dependence on one supplier.
Because these risks are different, businesses need more than one tool.
The Most Useful Financial Risk Management Tools
Some tools are sophisticated software platforms. Others are simple spreadsheets or calculations. The right solution depends on the size and complexity of the organization.
Here is a practical overview.
| Tool | What It Measures | Best Used For |
|---|---|---|
| Cash flow forecast | Future cash inflows and outflows | Liquidity planning |
| Scenario analysis | Impact of different possible outcomes | Strategic decisions |
| Position sizing tools | Capital at risk on an investment or trade | Investment risk control |
| Sensitivity analysis | Effect of changing one variable | Pricing, costs, revenue planning |
| Risk dashboard | Multiple risk indicators in one place | Ongoing monitoring |
| Diversification analysis | Concentration of exposure | Investments, customers, suppliers |
| Currency exposure tracker | Assets and liabilities by currency | International businesses |
| Debt ratio analysis | Ability to service borrowing | Financing decisions |
| Emergency reserve model | Required liquidity buffer | Business continuity |
| Break-even calculator | Minimum revenue required to cover costs | Launches and expansion |
The important point is not to use every tool available. It is to choose tools that answer the risks that actually matter to your business.
1. Cash Flow Forecasting
Profit and cash are not the same thing.
A company can appear profitable on paper and still run into trouble because customers have not paid invoices while payroll, taxes, suppliers, and rent are already due.
A cash flow forecast estimates how much money should enter and leave the business over a future period.
At minimum, a useful forecast should include:
Cash coming in:
- customer payments;
- recurring subscriptions;
- investment income;
- financing;
- other expected receipts.
Cash going out:
- salaries;
- rent;
- software;
- supplier payments;
- debt repayments;
- taxes;
- advertising;
- equipment;
- other operating expenses.
Do not create only an optimistic forecast.
Build at least a base case and a downside case. Seeing what happens when revenue arrives later than expected can reveal problems months before they become urgent.
2. Scenario Analysis
Forecasting asks, “What do we expect to happen?”
Scenario analysis asks, “What happens if our expectations are wrong?”
Imagine an ecommerce company generating $100,000 in monthly revenue.
Management could model several situations:
- revenue grows by 15%;
- revenue remains unchanged;
- revenue falls by 20%;
- advertising costs increase by 30%;
- the largest customer disappears;
- shipping costs rise sharply.
Each scenario can then be translated into cash flow, profit, and runway.
This gives decision-makers a much clearer view of what the company can withstand.
Scenario analysis is particularly useful before:
- hiring aggressively;
- taking on debt;
- opening a new location;
- entering another country;
- making a large capital investment;
- launching a new product.
The more difficult it would be to reverse a decision, the more valuable scenario planning becomes.
3. Position Sizing
Position sizing is commonly associated with trading, but the underlying concept is universal.
Instead of asking, “How much can I make?”, start with:
“How much am I willing to lose if I am wrong?”
Suppose an investor has $50,000 available but decides that no single speculative position should expose more than 1% of the portfolio to a predefined loss.
The risk budget is therefore $500.
The size of the investment should then be adjusted around that limit rather than around confidence, excitement, or fear of missing out.
Entrepreneurs can apply the same principle outside financial markets.
Before making a risky investment, define:
- the maximum acceptable loss;
- the conditions under which the idea is considered unsuccessful;
- the capital committed;
- the expected upside;
- whether losing that capital would threaten core operations.
This changes decision-making from emotional to structured.
4. Sensitivity Analysis
Business plans depend on assumptions.
The danger begins when those assumptions are treated as facts.
Sensitivity analysis changes one variable at a time and observes how strongly it affects the outcome.
For example, imagine a subscription company with the following assumptions:
- monthly subscription: $50;
- 1,000 customers;
- 4% monthly churn;
- customer acquisition cost: $120.
Management could ask:
What happens if churn increases to 6%?
What happens if acquisition costs rise to $160?
What happens if pricing needs to fall to $45?
You may discover that one variable barely matters while another dramatically changes profitability.
That tells management which numbers deserve the most attention.
5. Concentration and Diversification Analysis
Concentration can make a business look stronger than it really is.
Imagine that a company earns $1 million per year, but one customer accounts for $600,000.
Revenue looks healthy until that customer leaves.
The same problem can occur with:
- suppliers;
- geographic markets;
- currencies;
- traffic sources;
- lenders;
- investment assets;
- sales channels.
A basic concentration dashboard can show what percentage of revenue, spending, or capital depends on each source.
If one category dominates, management can decide whether diversification is worth the cost.
Diversification is not about spreading resources everywhere. It is about avoiding situations in which a single failure can threaten the entire system.
6. Currency Risk Tracking
International businesses face another risk that purely domestic companies may overlook: exchange rates.
A business might earn revenue in British pounds, pay contractors in euros, purchase software in U.S. dollars, and report its accounts in another currency.
Even if sales remain unchanged, currency movements can change margins.
A simple currency exposure table can help:
| Currency | Monthly Inflows | Monthly Outflows | Net Exposure |
| USD | $80,000 | $45,000 | +$35,000 |
| EUR | €20,000 | €35,000 | -€15,000 |
| GBP | £25,000 | £10,000 | +£15,000 |
This does not predict where exchange rates will move.
It simply shows where the business is vulnerable if they do.
That information can then guide pricing, payment timing, cash allocation, or hedging decisions.
7. Debt and Leverage Metrics
Debt can accelerate growth, but it reduces room for error.
Companies using borrowed capital should monitor metrics such as:
- debt-to-equity;
- interest coverage;
- debt service requirements;
- available credit;
- fixed versus variable interest exposure;
- maturity dates.
The most important question is not simply whether the company can afford debt under current conditions.
Ask whether it could still afford the debt under a weaker scenario.
If revenue fell 20% for six months, would repayments still be manageable?
If the answer is no, the company may have less financial flexibility than headline growth numbers suggest.
8. Emergency Reserve Planning
Individuals are frequently told to build emergency funds. Businesses need similar buffers.
Unexpected problems are not unusual:
- a large invoice is delayed;
- equipment fails;
- a supplier changes terms;
- a major customer cancels;
- advertising performance drops;
- a payment provider temporarily holds funds.
A reserve gives management time to solve the problem without immediately making desperate decisions.
Instead of choosing an arbitrary amount, calculate the company's essential monthly expenses.
Then estimate how many months of those expenses should remain accessible under a severe scenario.
A highly predictable subscription business may need a different buffer from a young startup with volatile revenue.
How to Build a Simple Risk Management System
Financial risk management does not need to begin with expensive enterprise software.
A small company can create a useful system in five steps.
Step 1: Identify the Risks
List events that could materially damage the company's financial position.
Focus on realistic risks rather than every theoretically possible disaster.
Step 2: Estimate Probability and Impact
For every risk, estimate:
- how likely it is;
- how much it could cost;
- how quickly it could happen;
- how difficult recovery would be.
Step 3: Set Risk Limits
Decide what level of exposure is acceptable.
Examples might include:
- no customer should represent more than 25% of revenue;
- maintain at least four months of essential operating costs;
- limit speculative investments to a fixed percentage of available capital;
- keep debt service below a predefined percentage of operating cash flow.
Step 4: Choose the Right Tool
Match each important risk with a measurable indicator.
Do not collect data simply because it is available.
Every metric should help answer a decision.
Step 5: Review Regularly
A risk model built two years ago may be almost useless today.
Customers change. Costs change. Markets change. Debt changes. Teams change.
Review the most important indicators monthly or quarterly, depending on how quickly the business moves.
What Makes a Good Risk Dashboard?
A good risk dashboard is usually simpler than people expect.
It should show the few indicators that can genuinely change a decision.
For a growing company, that might include:
- available cash;
- monthly burn rate;
- runway;
- accounts receivable overdue;
- largest customer as a percentage of revenue;
- debt obligations;
- currency exposure;
- gross margin;
- forecast versus actual revenue.
If the dashboard contains 70 metrics and nobody knows which five matter, it is not doing its job.
Clarity is part of risk management.
Common Financial Risk Management Mistakes
Even experienced entrepreneurs can fall into predictable traps.
Treating a Forecast as a Promise
A financial model is an estimate, not a guarantee.
Test what happens when assumptions fail.
Taking Bigger Risks After Success
Several successful decisions in a row can create the illusion that risk has disappeared.
It has not.
Keep risk limits consistent rather than increasing exposure purely because recent results were positive.
Ignoring Small Risks That Can Combine
One delayed customer may not matter. A weaker sales month may not matter. A currency move may not matter.
All three happening together might.
Risk should therefore be viewed at the portfolio or company level, not only one event at a time.
Measuring Risk Without Acting on It
A dashboard is useless if management never responds to the information.
Every major indicator should have a threshold that triggers discussion or action.
Technology Helps, but Discipline Matters More
Modern companies have access to powerful analytics platforms, accounting tools, dashboards, forecasting software, and financial calculators.
Yet software cannot decide how much risk an organization is genuinely prepared to accept.
That remains a management decision.
The most sophisticated model in the world will not protect a company whose leaders repeatedly ignore their own limits.
Likewise, a relatively simple spreadsheet can be extremely valuable when its rules are clear and consistently followed.
Final Thoughts
The best financial risk management tools have one thing in common: they make uncertainty easier to quantify.
Cash flow forecasts show when liquidity may become tight. Scenario analysis reveals what happens when assumptions fail. Position sizing controls exposure to an individual financial decision. Concentration analysis highlights dependence on one customer, supplier, currency, or asset. Debt metrics show how much financial flexibility remains.
Entrepreneurs do not need to predict every crisis.
They need enough information to recognize when a decision could threaten more capital than they intended.
Start small. Identify the three financial risks that could hurt your business most, assign a measurable indicator to each one, and establish a limit before the risk becomes urgent.
Financial risk management is not about becoming cautious.
It is about making sure one bad outcome does not erase years of good decisions.








Leave a Reply